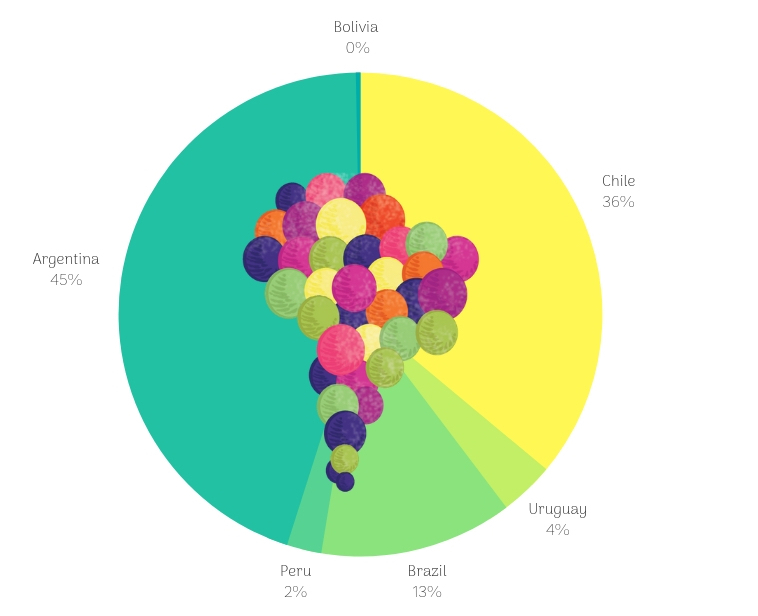
Looking for some solid statistics on South American wine production? Here are the most recent reports on South American wine production. Currently, Argentina is the biggest wine producer in South America, followed by Chile, Brazil, Uruguay, Peru and Bolivia. Here’s the latest South American wine production numbers
South American Wine Production
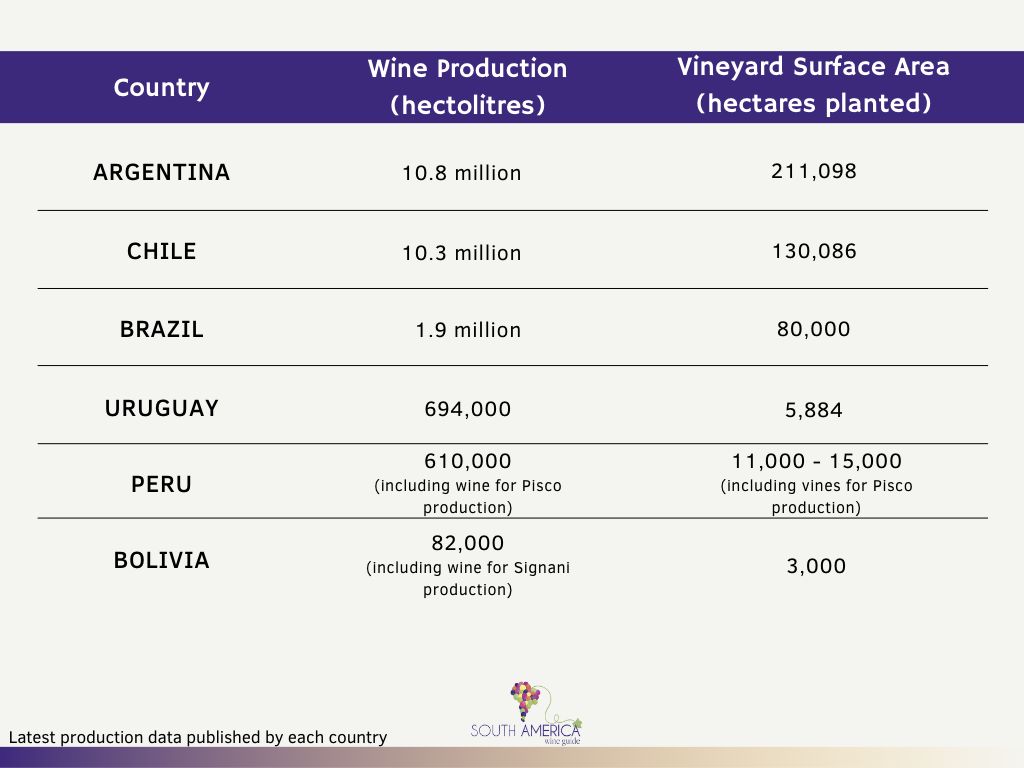
Argentina – Wine production statistics
MOST IMPORTANT GRAPE VARIETIES (% of production)

LATEST STATISTICS ON WINE PRODUCTION
Argentina wine production statistics, 2021
Argentina wine production statistics, 2020
Argentina wine production statistics, 2019
MENDOZA WINE PRODUCTION
Mendoza overview by Wines of Argentina
Uco Valley: Wine production statistics (INV, 2019) & the INV’s Special Report on Uco Valley 2019
Eastern Mendoza: Wine production statistics (INV, 2019)
Central Mendoza (Luján de Cuyo, Maipú, Guaymallen, Godoy Cruz): Wine production statistics, INV 2019
North Mendoza (Lavalle, Las Heras): Wine production statistics (INV, 2019) & the INV’s Special Report on North Mendoza 2019
South Mendoza (San Rafael, General Alvear): Wine production statistics (INV, 2019) & the INV’s Special Report on Southern Mendoza 2019
NORTH & SOUTH ARGENTINA WINE PRODUCTION
Northern Argentina (La Rioja, Salta, Catamarca, Tucumán, Jujuy): Wine production statistics, INV 2018
Southern Argentina (Río Negro, Neuquén, La Pampa, Chubut): Wine production statistics, INV 2018
Rest of Argentina: Wine production statistics, INV 2019
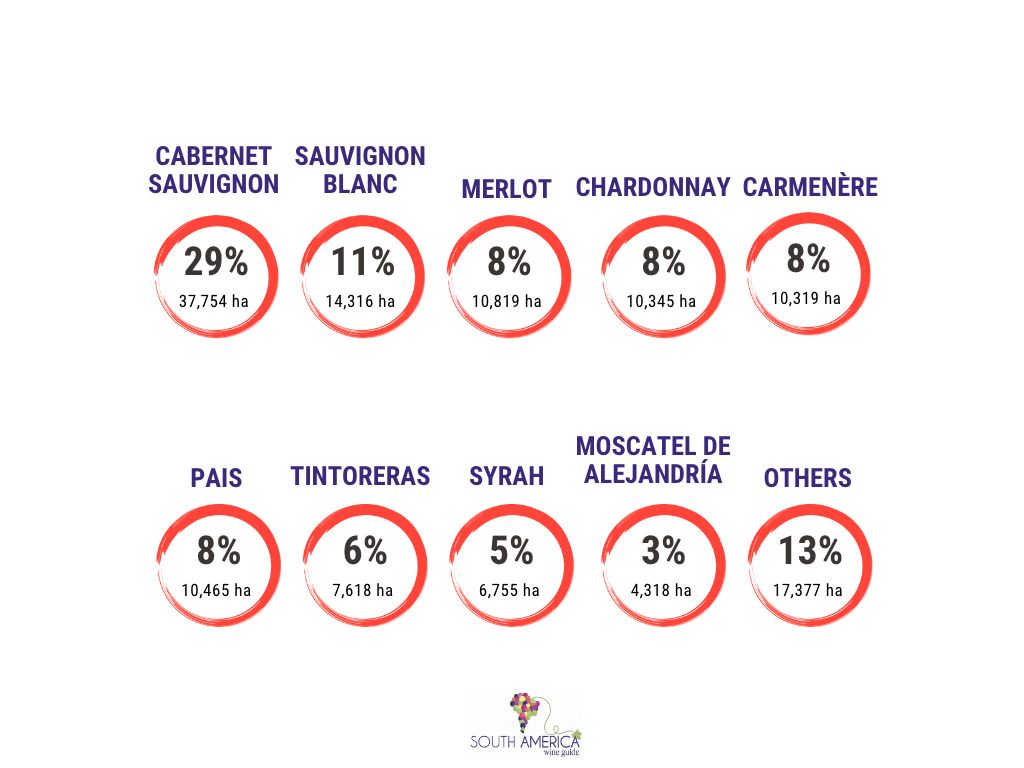
Chile – Wine production statistics
MOST IMPORTANT GRAPE VARIETIES (% of production)
LATEST STATISTICS ON WINE PRODUCTION
Chile wine production statistics, 2021
Chile wine production statistics, 2020
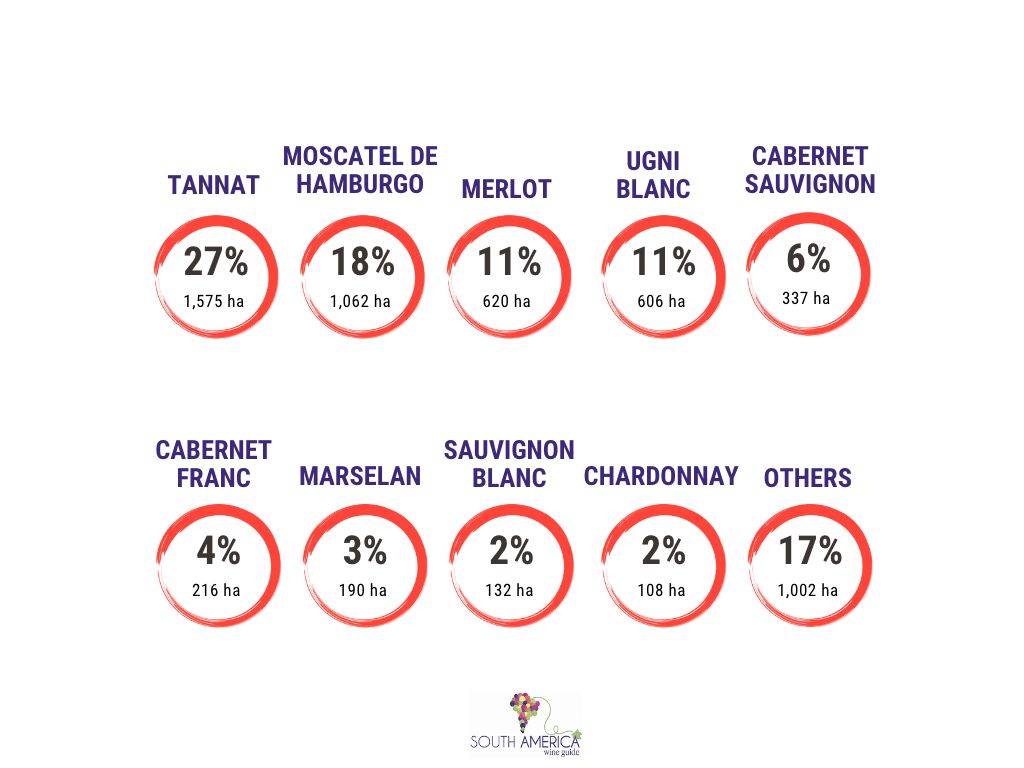
Uruguay – Wine production statistics
MOST IMPORTANT GRAPE VARIETIES (% of production)
LATEST STATISTICS ON WINE PRODUCTION
Uruguay wine production statistics, 2021
Uruguay wine production statistics, 2020
Uruguay wine production statistics, 2019
Brazil – Wine production statistics
Rio Grande do Sol: Wine production 2013-2015
Bolivia – Wine production statistics
Bolivia: Wine production statistics 2014
HECTARES PLANTED & WINE PRODUCTION
- 3,000 hectares of vineyards planted in Bolivia
- Over 93% of wine production is in Tarija Valley
- 8.26 million litres of wine produced annually
- Over 65 wineries
GRAPE VARIETIES AND WINE STYLES
Over 70% of the grapevines in Bolivia are Muscat (mainly used for Singani production). However of wine grapes used for wine production:
- 77% are red wines
- 20% are white wines
- 3% are rosé, dessert, sparkling and fortified wines
Read more on wine production and the history of wine in Bolivia.
Wine consumption in South America
Wine consumption per capita in Argentina was at 18.9 litres in 2018
Take a look at the historical statistics here: Wine consumption per capita in Argentina 1962 till 2018.
Are you interested in the latest world wine production statistics too? Take a look over 80 Harvests where we have the latest world wine production data